ADR, Booking Trends & Channel Insights (2018–2020)
This dashboard explores ADR evolution, booking lead times, monthly channel variance, and market segment mix across years. Visuals help revenue managers understand guest behavior, pricing shifts, and performance across OTA and direct channels.
Key Metrics Covered
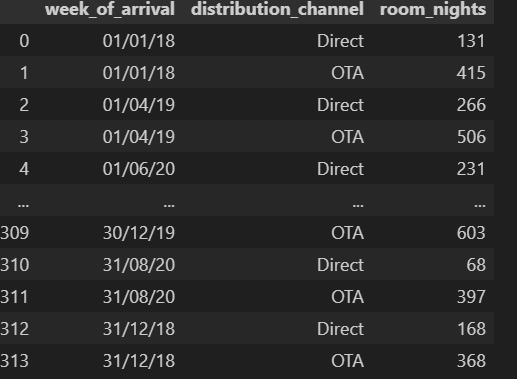
- Booking Pace: OTA vs Direct weekly bookings
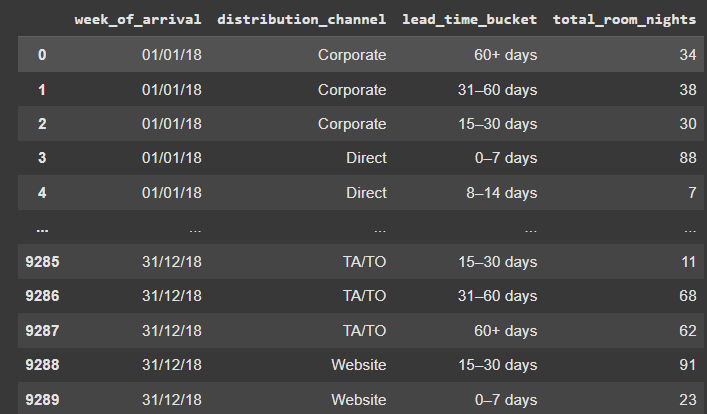
- Lead Time: Segmenting reservations by advance window
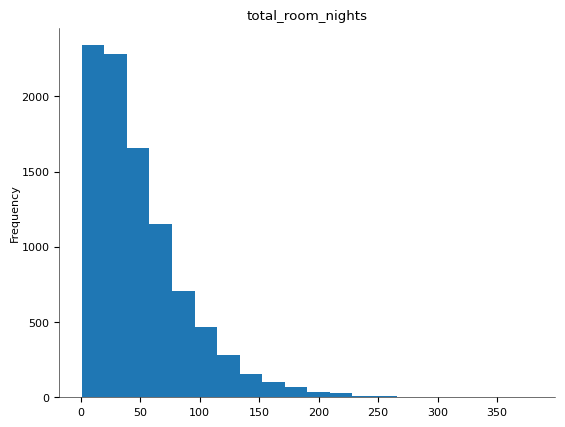
- KPI Breakdown: Room Nights, Revenue, ADR
- Monthly Variance: MoM OTB comparisons
- Mix % & Channel Share: Contribution of each segment
- ADR Trends: Month-over-month changes in average rates
Visual Charts

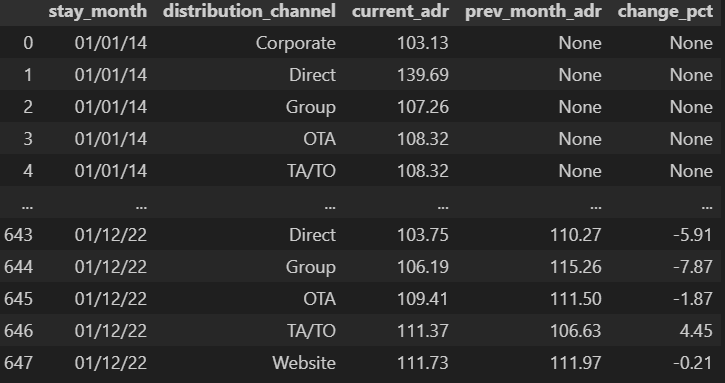
Channel Mix & ADR Change

