📊Properties Averages Summary
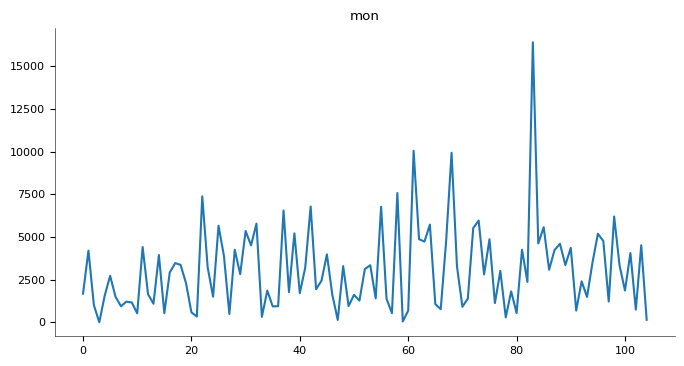
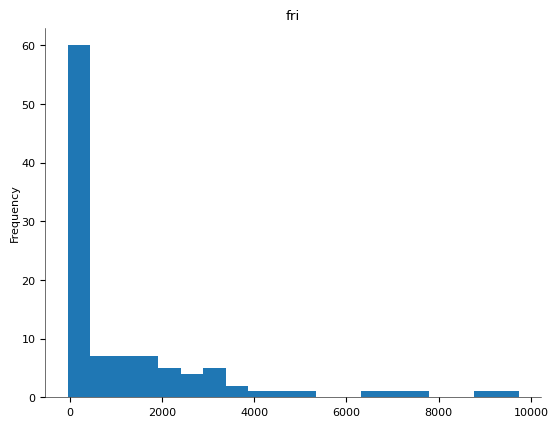
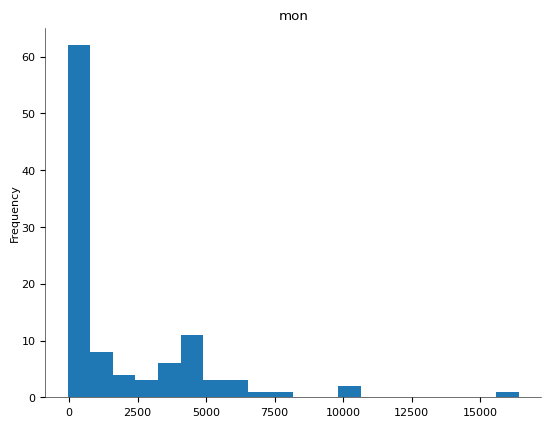
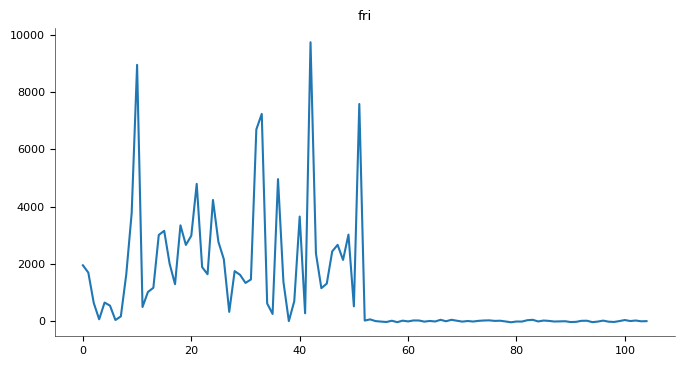
Visualize weekly differences between forecasted and actual room nights sold and ADR, highlighting deviations that guide forecast improvements.
Properties Segment Overview
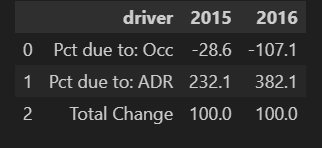
understanding what drives RevPAR change helps you: Identify whether growth is volume-driven (Occupancy) or rate-driven (ADR). Adjust strategy: If ADR is flat but occupancy rises → pricing opportunity. Align forecasting and pricing strategy by segment or season.
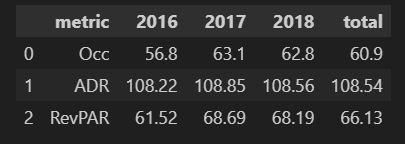
Properties' Averages
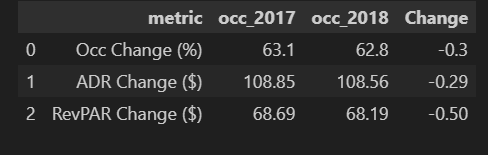
Average Changes
Drivers of RevPAR Changes
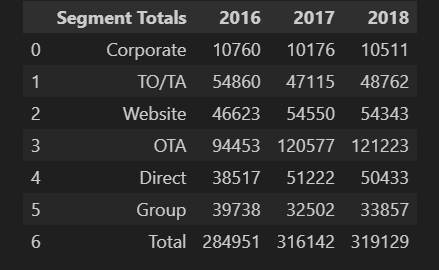
Segment Total
Room Nights How many were generated by each distribution channel (segment) over three years. Why it's important: 🧭 Tracks segment growth (e.g., Is OTA growing while Direct is shrinking?) 💰 Revenue strategy alignment (e.g., push high-ADR segments) 🎯 Marketing targeting (e.g., re-engage underperforming channels)
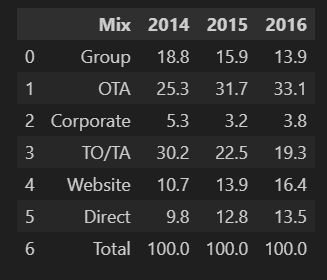
MIX (%) by Segmentfor each year — which shows how much each Segment to the total business annually. 🧠 Why This Query is Important Shows reliance on OTAs, Direct, TO/TA, etc. Helps identify shifts in booking patterns over time Useful for strategic planning and segment targeting Reveals disintermediation opportunities (e.g., shift OTA to Direct)
Room Nights by Segment
MIX (%) by Segment
Charts - Room Nights by Segment
Charts - MIX (%) by Segment
ADR by Segment How many were generated by each distribution channel (segment) over three years. Why it's important: 🧭 It tracks pricing trends by Segment. 🎯 Helps identify underpriced or overpriced segments. 💰 Supports revenue optimization and strategic rate setting. 📈 Helps identify high-yield vs low-yield segments Informs pricing strategies by segment and year Enables benchmarking over time Foundation for RevPAR decomposition (ADR × Occ%)
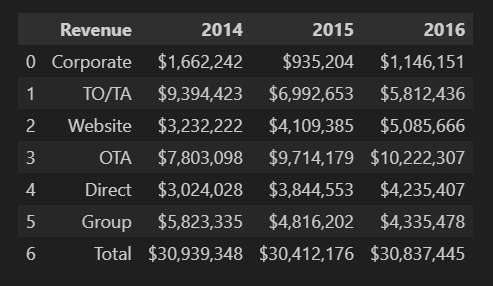
Revenue by SegmentCalculates total revenue per segment for each year from 2014 to 2016. 🧠 Why This Query is Important Tracks revenue contribution by segment across years. Identifies growth trends or underperforming channels. Useful for budgeting, forecasting, and strategic allocation.
ADR by Segment

Revenue by Segment
Charts - DR by Segmentt
Charts - Revenue by Segment
Segment Changes
What This Query Is About: This query tracks CHANGES happened on Room Nights, ADR ,Mix ,RevPAR and Revenue by Segment (e.g., Corporate, Group, Contract) across three years (2014–2016), and it categorizes them into:
🧠Why This Query Is Important: 📊 Segment Change : It tells you which segments are growing or declining in contribution. 📈 Transient vs Group mix tracking: Helps you monitor balance between transient (short-stay, rate-sensitive) and group (block) business. 🧩 Forecasting & Budgeting: These trends guide how to allocate sales effort, adjust rate strategy, or optimize inventory. 🔍 Strategy Refinement: Spot where demand shifts are occurring by year.
MIX (%) by Segmentfor each year — which shows how much each Segment to the total business annually. 🧠 Why This Query is Important Shows reliance on OTAs, Direct, TO/TA, etc. Helps identify shifts in booking patterns over time Useful for strategic planning and segment targeting Reveals disintermediation opportunities (e.g., shift OTA to Direct)
Room Nights Change by Segment
MIX (%) by Segment
Charts - Room Nights by Segment
Charts - MIX (%) by Segment
ADR by Segment How many were generated by each distribution channel (segment) over three years. Why it's important: 🧭 It tracks pricing trends by Segment. 🎯 Helps identify underpriced or overpriced segments. 💰 Supports revenue optimization and strategic rate setting. 📈 Helps identify high-yield vs low-yield segments Informs pricing strategies by segment and year Enables benchmarking over time Foundation for RevPAR decomposition (ADR × Occ%)
Revenue by SegmentCalculates total revenue per segment for each year from 2014 to 2016. 🧠 Why This Query is Important Tracks revenue contribution by segment across years. Identifies growth trends or underperforming channels. Useful for budgeting, forecasting, and strategic allocation.
ADR by Segment
Revenue by Segment
Charts - DR by Segmentt
Charts - Revenue by Segment
🔎 Segment-Level Forecast Accuracy
Track how accurately each market segment performed against projected values. Pinpoint which segments are most predictable and which need better modeling.

ADR by Segment How many were generated by each distribution channel (segment) over three years. Why it's important: 🧭 It tracks pricing trends by Segment. 🎯 Helps identify underpriced or overpriced segments. 💰 Supports revenue optimization and strategic rate setting. 📈 Helps identify high-yield vs low-yield segments Informs pricing strategies by segment and year Enables benchmarking over time Foundation for RevPAR decomposition (ADR × Occ%)
Revenue by SegmentCalculates total revenue per segment for each year from 2014 to 2016. 🧠 Why This Query is Important Tracks revenue contribution by segment across years. Identifies growth trends or underperforming channels. Useful for budgeting, forecasting, and strategic allocation.
ADR by Segment
Revenue by Segment
Charts - DR by Segmentt
Charts - Revenue by Segment
📅 Booking Window Impact
Understand how lead time affects forecasting reliability. Longer lead windows often introduce more volatility and deviation from expected demand.

ADR by Segment How many were generated by each distribution channel (segment) over three years. Why it's important: 🧭 It tracks pricing trends by Segment. 🎯 Helps identify underpriced or overpriced segments. 💰 Supports revenue optimization and strategic rate setting. 📈 Helps identify high-yield vs low-yield segments Informs pricing strategies by segment and year Enables benchmarking over time Foundation for RevPAR decomposition (ADR × Occ%)
Revenue by SegmentCalculates total revenue per segment for each year from 2014 to 2016. 🧠 Why This Query is Important Tracks revenue contribution by segment across years. Identifies growth trends or underperforming channels. Useful for budgeting, forecasting, and strategic allocation.
ADR by Segment
Revenue by Segment
Charts - DR by Segmentt
Charts - Revenue by Segment
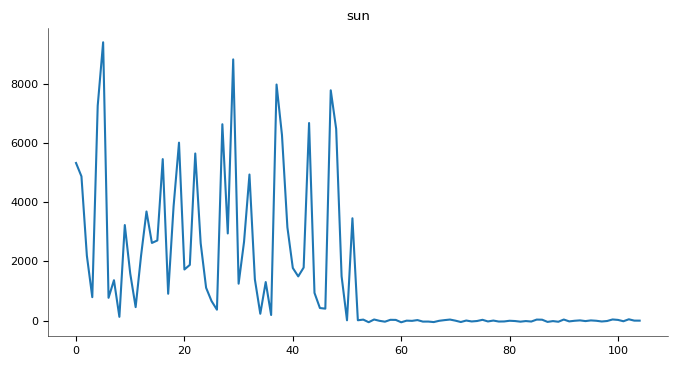
📉 Forecast Error by Week
Analyze weeks with largest forecasting errors to adjust model assumptions and improve future planning for revenue, staffing, and inventory.

ADR by Segment How many were generated by each distribution channel (segment) over three years. Why it's important: 🧭 It tracks pricing trends by Segment. 🎯 Helps identify underpriced or overpriced segments. 💰 Supports revenue optimization and strategic rate setting. 📈 Helps identify high-yield vs low-yield segments Informs pricing strategies by segment and year Enables benchmarking over time Foundation for RevPAR decomposition (ADR × Occ%)
Revenue by SegmentCalculates total revenue per segment for each year from 2014 to 2016. 🧠 Why This Query is Important Tracks revenue contribution by segment across years. Identifies growth trends or underperforming channels. Useful for budgeting, forecasting, and strategic allocation.
ADR by Segment
Revenue by Segment
Charts - DR by Segmentt
Charts - Revenue by Segment
📈 Trend of Forecast Accuracy Over Time
Evaluate whether forecasting performance is improving year-over-year, indicating successful adjustments and model tuning.

ADR by Segment How many were generated by each distribution channel (segment) over three years. Why it's important: 🧭 It tracks pricing trends by Segment. 🎯 Helps identify underpriced or overpriced segments. 💰 Supports revenue optimization and strategic rate setting. 📈 Helps identify high-yield vs low-yield segments Informs pricing strategies by segment and year Enables benchmarking over time Foundation for RevPAR decomposition (ADR × Occ%)
Revenue by SegmentCalculates total revenue per segment for each year from 2014 to 2016. 🧠 Why This Query is Important Tracks revenue contribution by segment across years. Identifies growth trends or underperforming channels. Useful for budgeting, forecasting, and strategic allocation.
ADR by Segment
Revenue by Segment
Charts - DR by Segmentt
Charts - Revenue by Segment