Market Segment Booking Pace - Summary Analysis
Months View Starting Realized vs Last Year
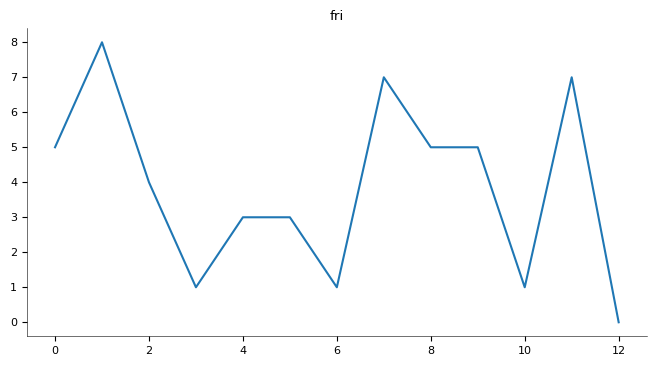
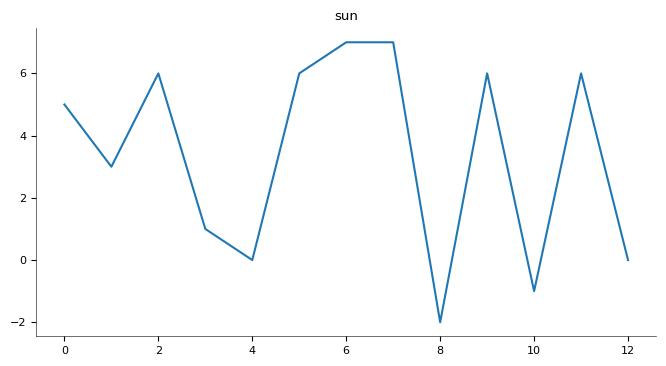
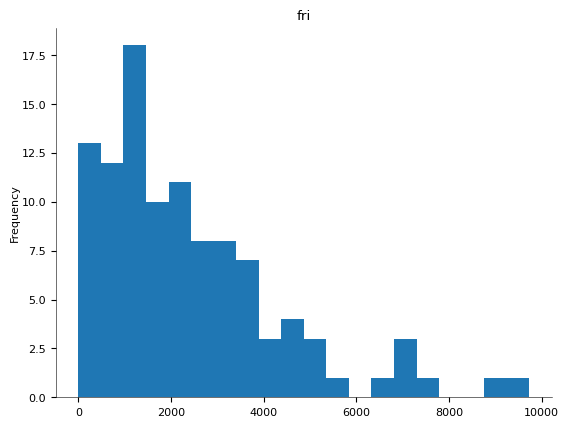
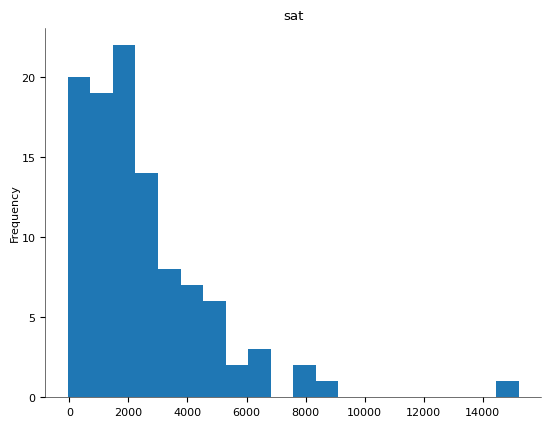
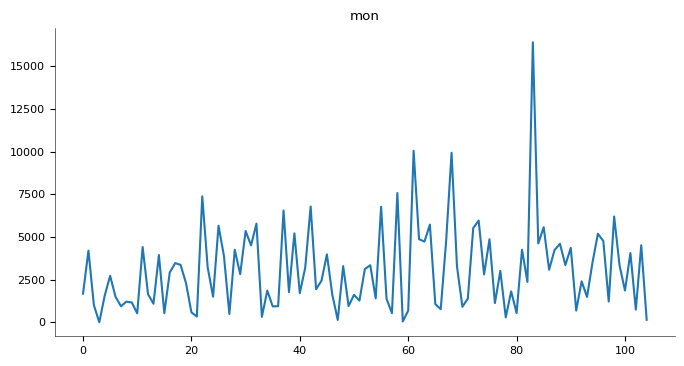
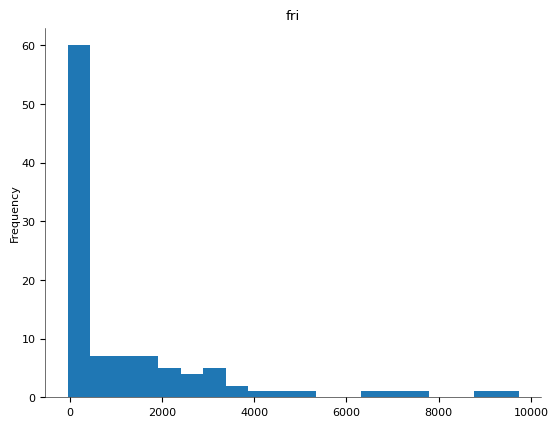
*Weekly Bases display Current Year VS ast Year Forecast**
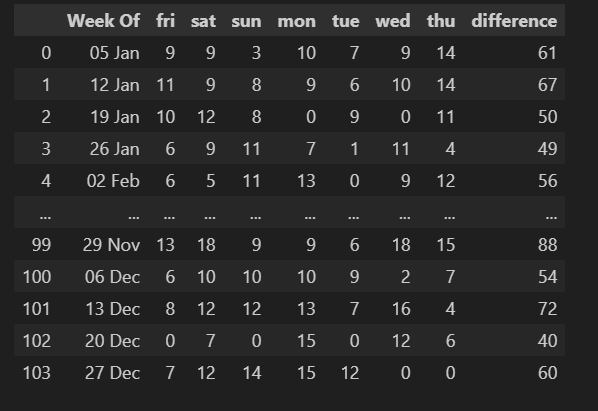
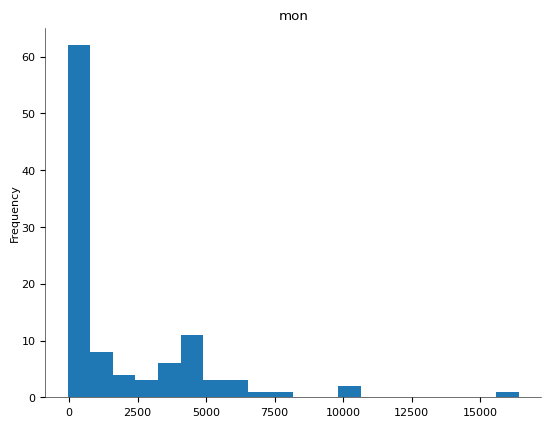
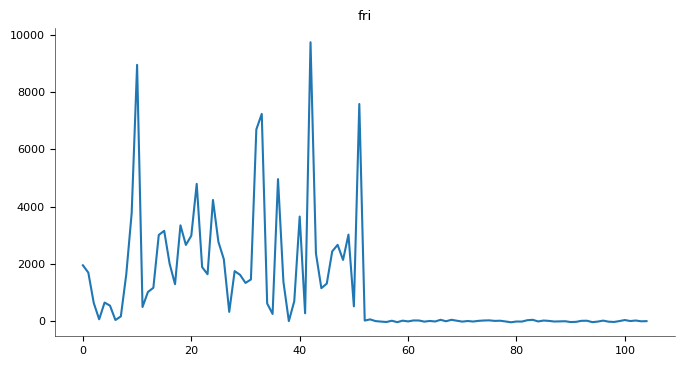
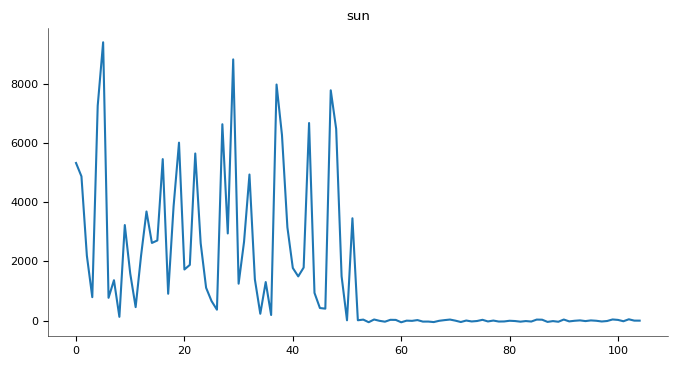
Tracks Weekly Booking Trends: Helps visualize how many more or fewer rooms are booked now compared to the same week last year, per day. Spot Underperformance: Highlights weak weekdays (e.g., if Fridays are consistently underbooked YoY). Supports Forecast Accuracy: Used to validate or adjust forecasts based on pacing vs. last year. Enables Actionable Insight: Sales/marketing can push promotions on underperforming days or weeks. Monitors Growth or Decline: Helps assess the effectiveness of revenue management strategies over time.
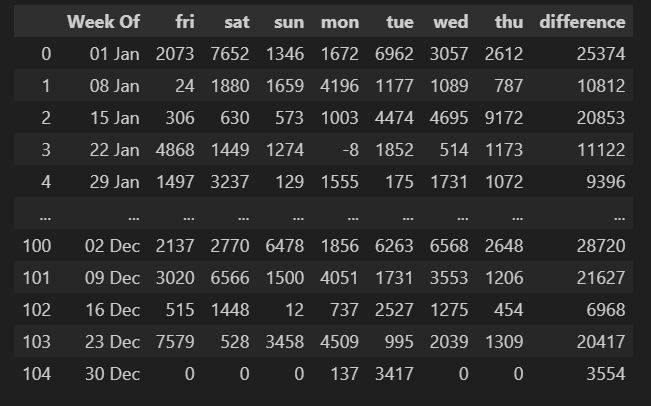
"On The Book" Mix To Last Year
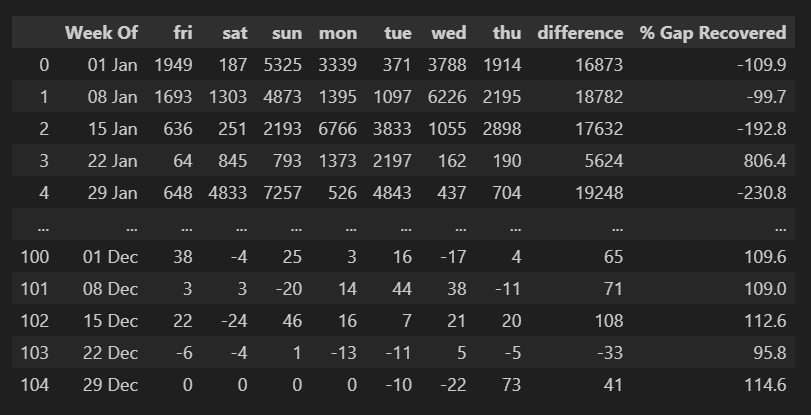
Current Mix To Last Year Forecast - LY Actual
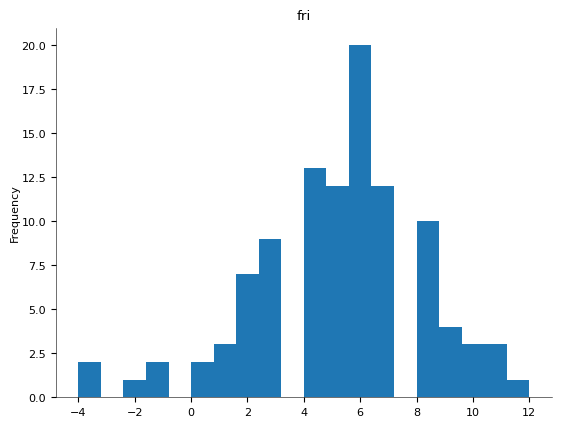
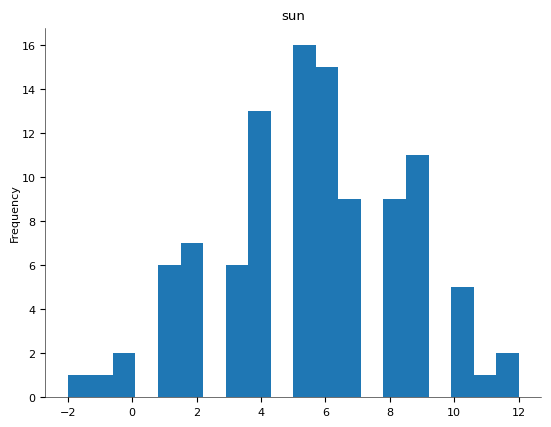
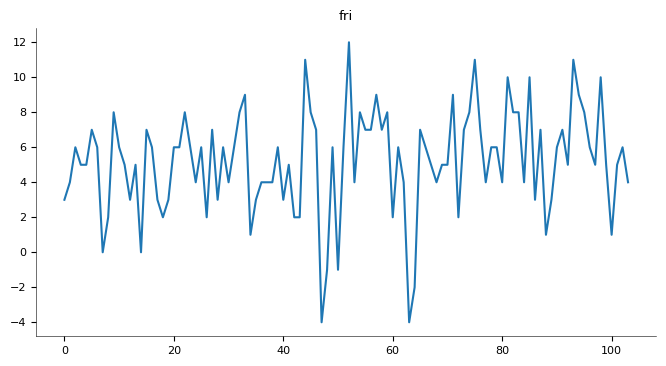
Charts - "On The Book" Mix

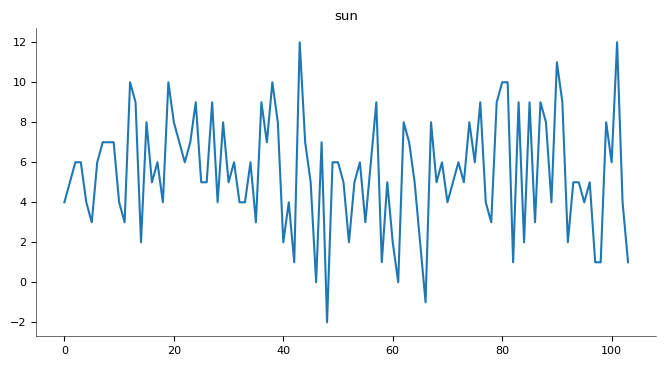
Charts - Current Mix vs LY Forecast
OTB Variance & Pickup Analysis
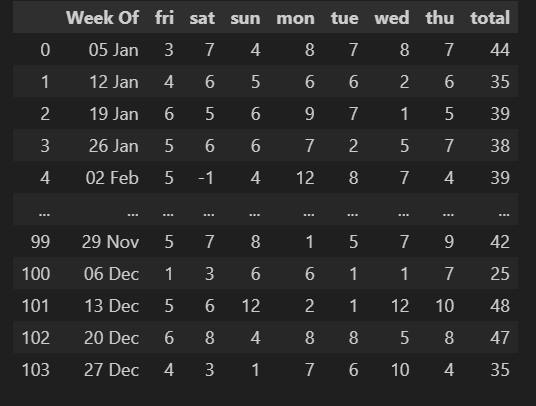
"On The Book" Variance To 1 Period Ago
Pickup Variance To 1 Period Ago
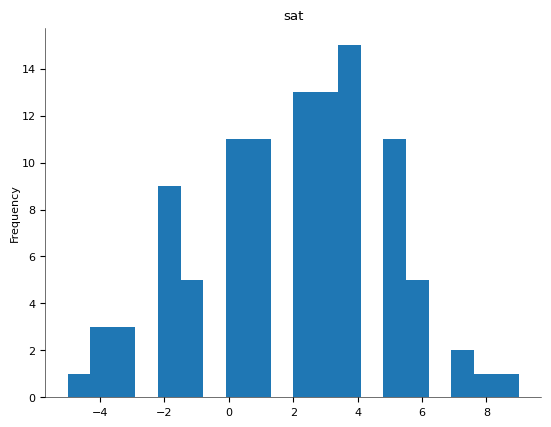
Charts - OTB Variance
Charts - Pickup Variance
Segment Overview
OTB Mix %
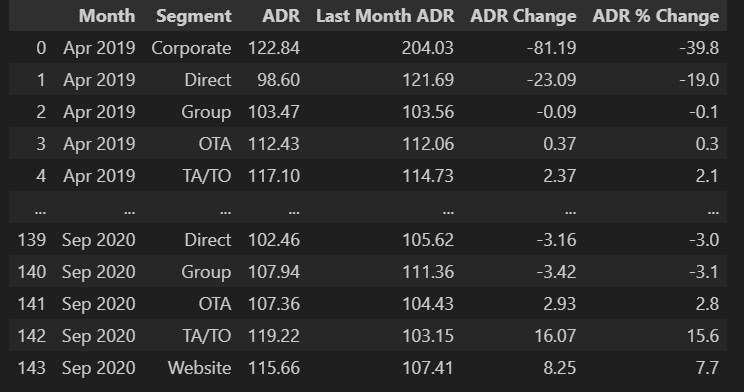
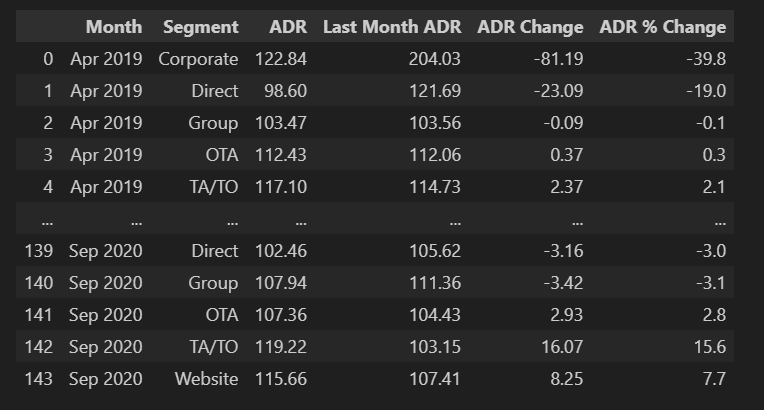
Segment ADR
Segment ADR Change From Last Week