Why is RevPAR More Important than ADR?
RevPAR(Revenue per Available Room) = ADR × Occupancy Rate
It tells you: “How much revenue did each available room generate, regardless of whether it was sold?”
ADR (Average Daily Rate) = Room Revenue ÷ Rooms SoldIt tells you: “How much revenue did each sold room generate?”
Why RevPAR > ADR in Importance:
| Aspect | ADR | RevPAR |
|---|---|---|
| Focus | Only considers rate | Combines rate + occupancy |
| Blind Spots | Ignores unsold rooms | Captures total performance |
| Manipulability | Can be inflated by selling fewer rooms at higher prices | Balances price and volume |
| Strategic Use | Shows pricing strength | Shows revenue efficiency per available room |
| Forecasting Use | Less accurate alone | Better KPI for forecasting and budgeting |
Real Hotel Example:
| Hotel A | Hotel B |
|---|---|
| ADR = $200 | ADR = $150 |
| Occupancy = 40% | Occupancy = 80% |
| RevPAR = $80 | RevPAR = $120 ✅ |
| Higher rate, lower occupancy | Lower rate, higher occupancy |
💡 Summary:
- ADR is rate-focused- Read more about establishing room rate
- RevPAR is revenue-focused
- RevPAR is the superior metric because it balances price and demand, guiding better strategy decisions
📘 Segment Mix: A Strategic Guide to Identify, Analyze & Optimize
Segment Mix is a critical lever in hotel revenue management. it refers to the percentage of room nights or revenue contributed by each market segment — such as Corporate, OTA, Direct, Tour Operator, Group, and others. Improving your segment mix doesn't always mean selling more rooms — it means selling the right rooms, to the right segments, at the right price.
Understanding your Segment Mix is critical to managing revenue and demand effectively.
Each segment (e.g., OTA, Direct, Corporate, Tour Operator) contributes differently to your business in terms of volume, rate, lead time, and cost of acquisition. Here’s a step-by-step guide to analyzing and improving your Segment Mix for the current year
1️⃣ Identify Your Segment Mix
- What share of your total room nights or revenue comes from each booking segment?
- Are you overly dependent on one segment (e.g., OTA)?
- • Which segments are growing or shrinking month-over-month?
Start by asking:
- What % of bookings or revenue came from each segment (e.g., OTA, Direct, Corporate)?
- Which segments dominate high-demand vs. low-demand periods? 💡Tip: Use monthly or quarterly data to monitor shifts in mix trends
2️⃣ Where to Spot It
You can find Segment Mix insights in:
- On-the-Books reports: Weekly or monthly breakdowns by channel or segment
- PMS or BI dashboards: Visualize segment contribution (Room Nights %, Revenue %, ADR)
- Reservation reports: Look at booking source + lead time
3️⃣ How to Improve Your Segment Mix
Once you've identified opportunities, focus on shifting volume toward high-value segments while protecting pricing power: toward higher-margin segments:✅
✅ Direct Channel Growth
- Improve conversion with rate parity, loyalty incentives, and website usability
- Use pre-arrival upgrades or personalized offers to convert repeat OTA guests
✅ Corporate & Special Rates
- Negotiate corporate contracts based on volume commitment vs. discount
- Track underperforming accounts and re-price based on actual contribution
✅ Group Strategy
- Analyze booking pace by month/year
- Set rate floors and target rates by season and group size
- Ensure Sales Teams quote escalated or dynamic rates for future bookings
✅ Balance short and long-lead segments
- Push early booking offers for long-lead segments (e.g., TO, Corporate)
- Control OTA availability closer to arrival date
✅ Adjust your rate strategy by segment:
- Avoid deep discounts for segments already offering high volume
- Create Rate fencing rules (e.g., minimum stay, non-refundable) by segment to protect RevPAR
✅ Monitor cost of acquisition:
- Don't just chase volume — favor segments with higher net revenue contribution
📊 Remember: A strong Segment Mix isn't about having all segments — it's about having the right balance based on your season, rate strategy, and business goals
📊 Analysis: Revenue Trends and What the Numbers Are Telling Us
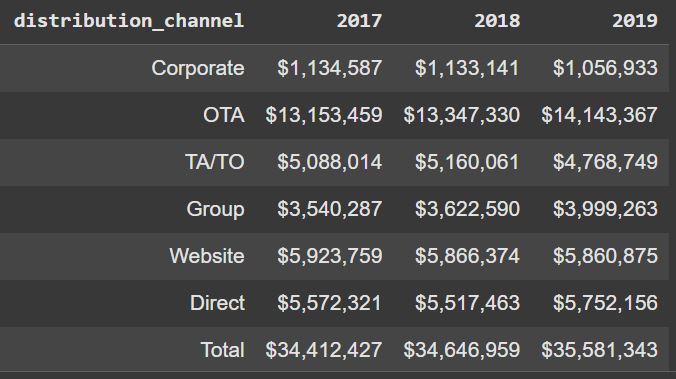
Year-over-Year Revenue by Distribution Channel
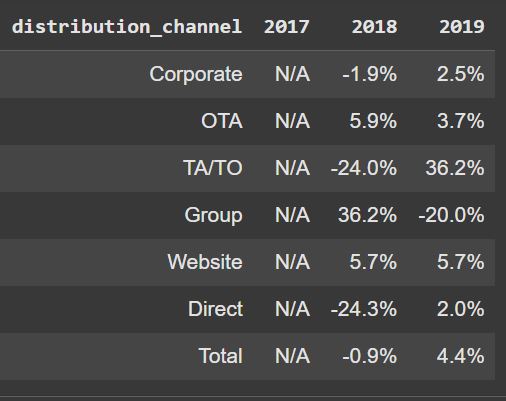
Revenue Growth % by Distribution Channel
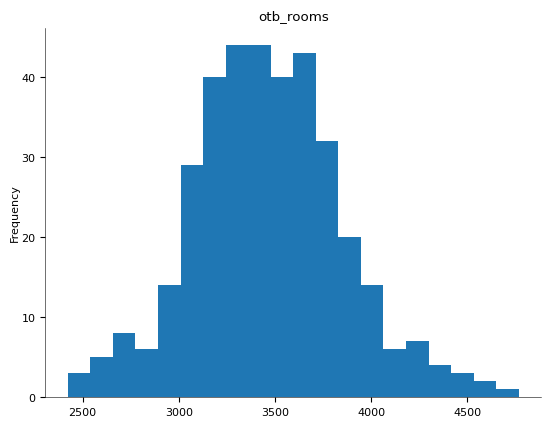
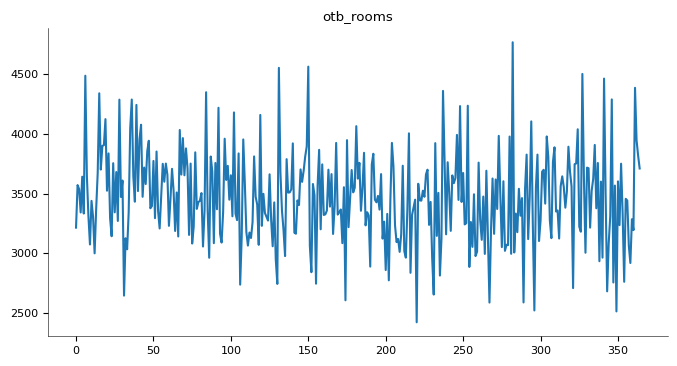
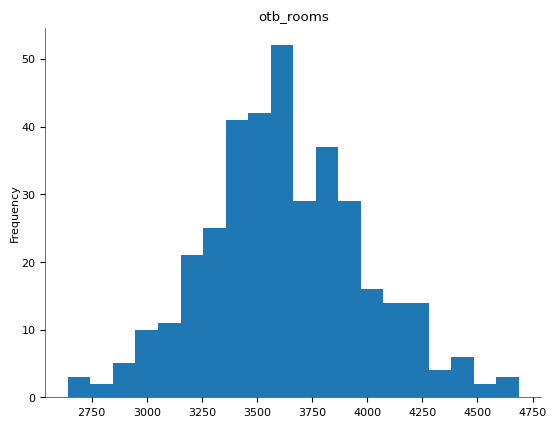
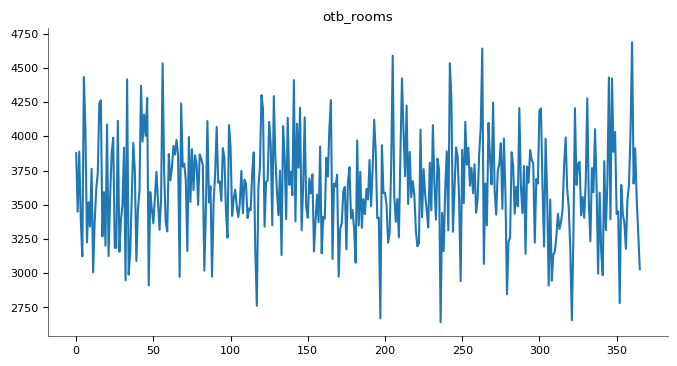
Charts - OTB Variance
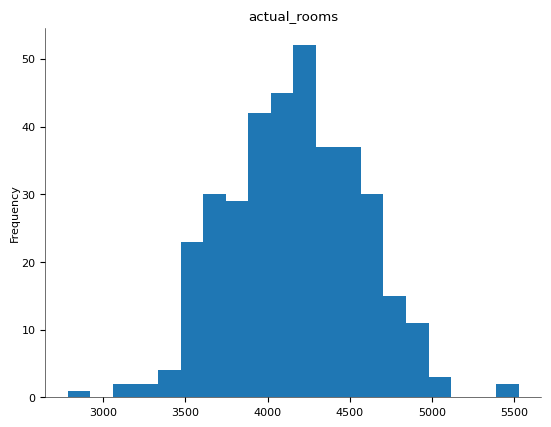
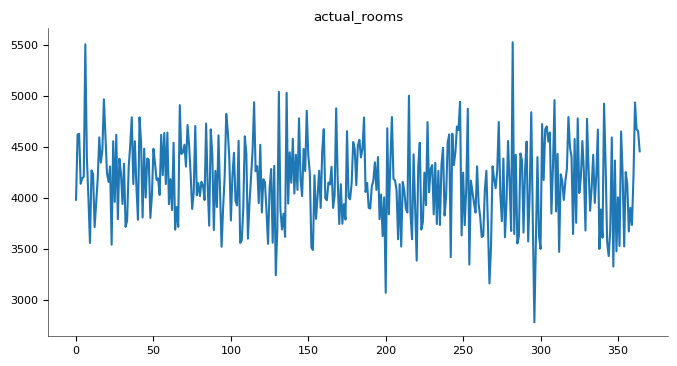
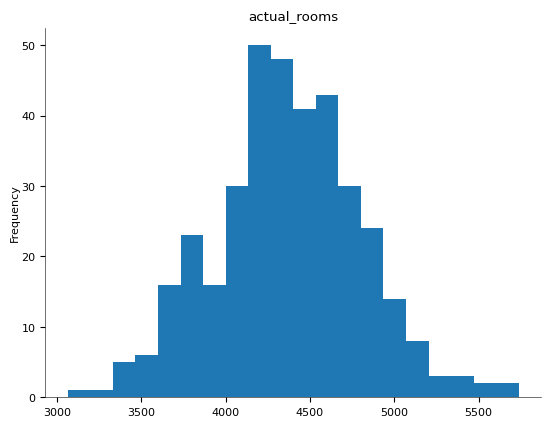
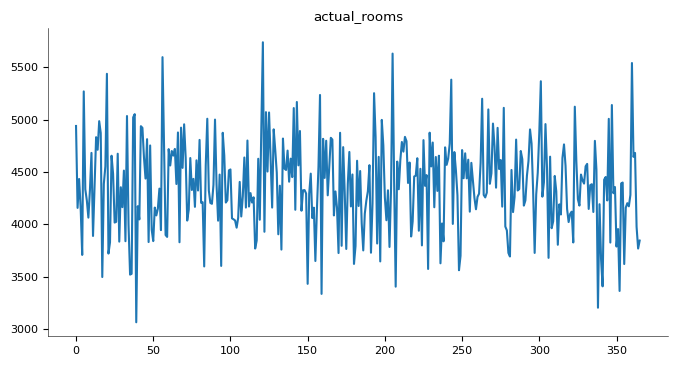
Charts - Pickup Variance
| Channel | 2017 Revenue | 2018 Revenue | 2019 Revenue | Trend |
|---|---|---|---|---|
| Corporate | $1.13M | $1.13M | $1.05M | ⬇️ Slight decline |
| OTA | $13.15M | $13.35M | $14.14M | ⬆️ Strong growth |
| TA/TO | $5.09M | $5.16M | $4.77M | ⬇️ Decline in 2019 |
| Group | $3.54M | $3.62M | $3.99M | ⬆️ Steady growth |
| Website | $5.92M | $5.87M | $5.86M | ⬇️ Flat/slightly down |
| Direct | $5.57M | $5.52M | $5.75M | ⬆️ Recovery in 2019 |
| Total | $34.41M | $34.64M | $35.58M | ⬆️ Overall growth |
Overall Revenue Grew:
- Total revenue increased from $34.41M in 2017 to $35.58M in 2019.
- This is a ~3.3% increase over two years, indicating steady performance
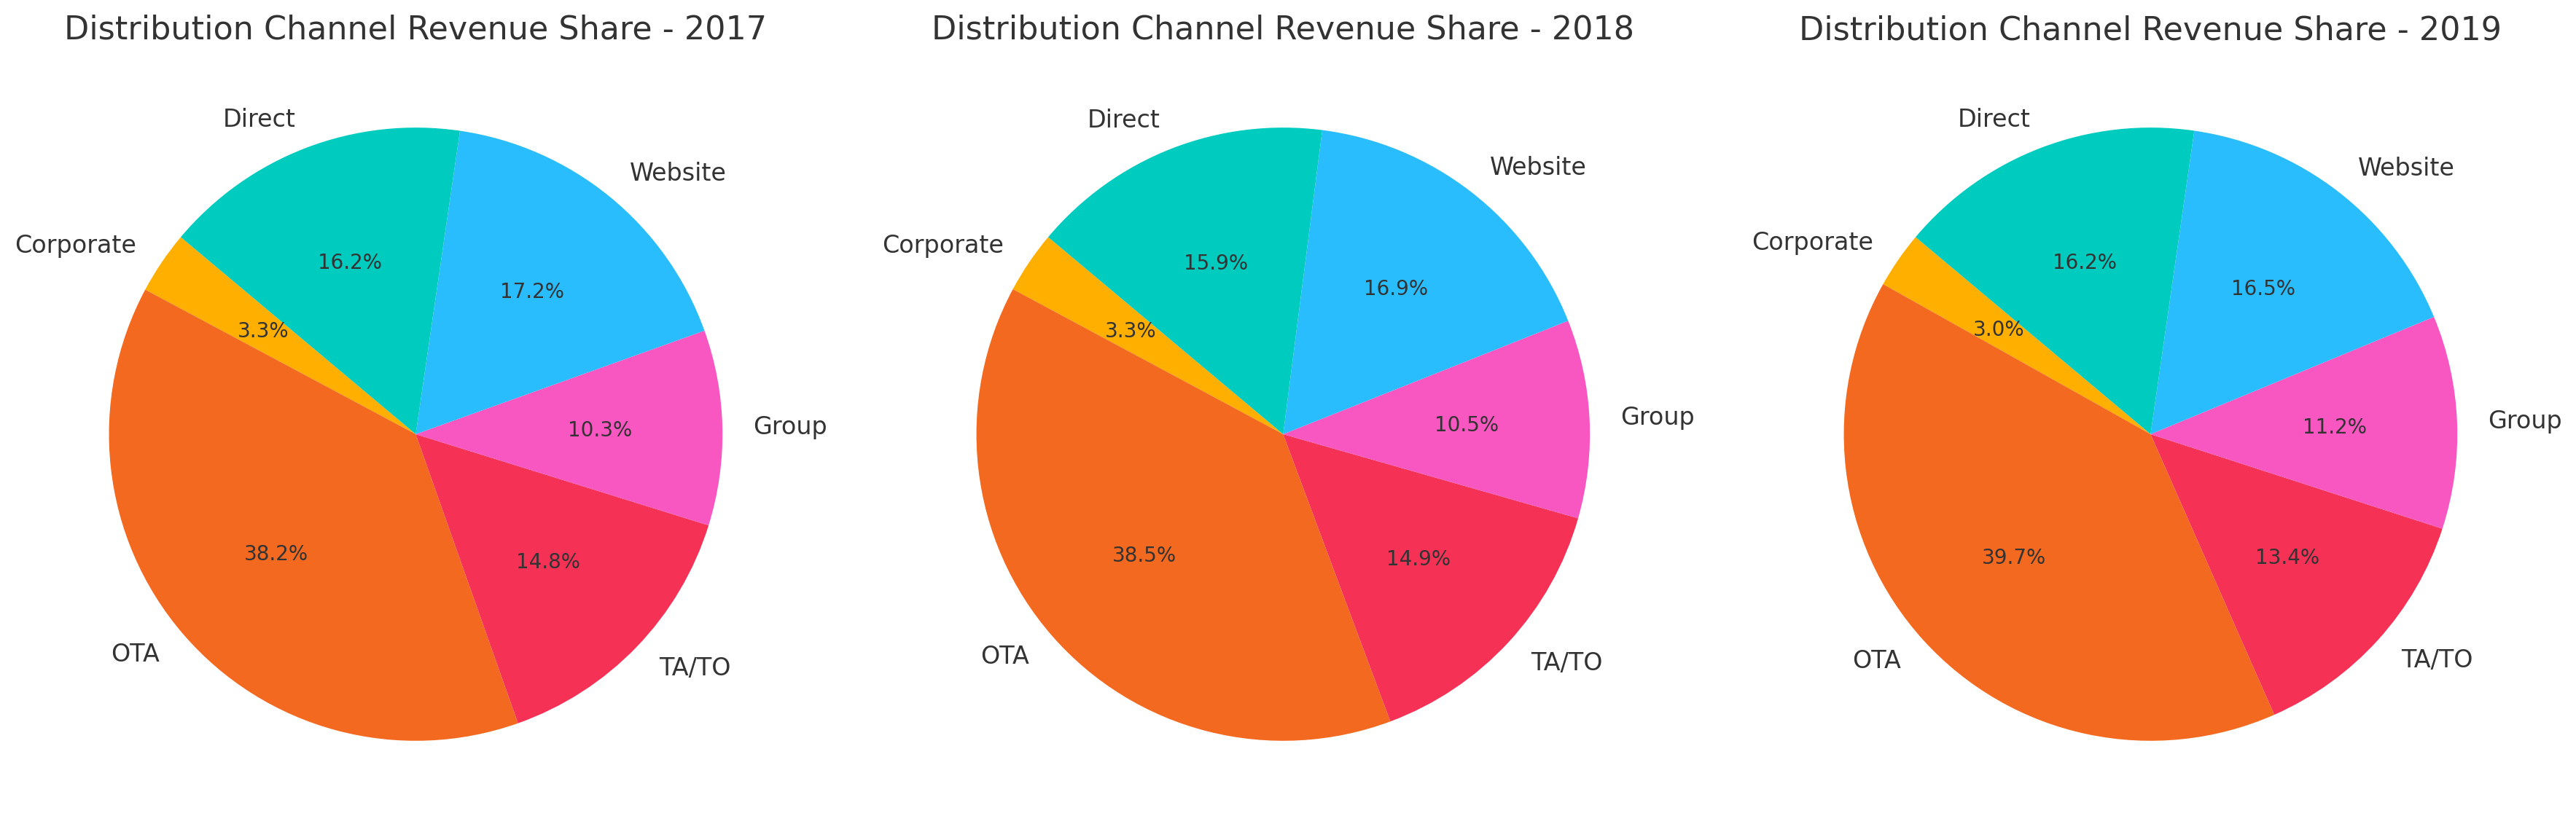
OTA Dominance is Increasing:
- OTA revenue grew by nearly $1M from 2017 to 2019.
- OTA is now the largest single contributor, accounting for ~40% of total revenue.
- This may imply increased dependency on third-party platforms (with higher acquisition costs).
Corporate Segment Decline:
- Corporate revenue fell by ~$78K between 2017 and 2019.
- Could suggest reduced negotiated corporate volume, rate resistance, or shift to other channels.
TA/TO Revenue Dropped in 2019:
- After small gains in 2018, revenue dipped in 2019 by ~$390K.
- Possible reasons: contract renegotiations, rate capping, or shift to direct/OTA bookings.
Group Business Is Recovering:
- Consistent growth YoY (+$459K since 2017).
- Indicates strength in meetings/events or weekend group segments.
Website and Direct Channels Are Flat:
- These are critical low-cost, high-margin channels.
- Their stagnation suggests a missed opportunity to drive direct business growth.
🎯 Recommendations: How to Act on These Trends
- ✅ Increase Direct Booking and Promot Your Website
- Invest in marketing to convert OTA guests to repeat direct bookings.
- Use loyalty programs, promo codes, and direct-only perks.
- Optimize your booking engine and mobile UX.
- ✅ Leverage Group Growth
- Maximize group business in off-peak or shoulder seasons.
- Push for dynamic pricing for group contracts booked far in advance.
Revenue Contribution by Distribution Channel
Revenue Contribution by Distribution Channel (2017–2019)
Year-over-Year Revenue Growth % by Distribution Channel (2018–2019)
📊 Understanding the Output: What the Percentages Tell UsThis query calculates the year-over-year percentage change in total revenue by distribution channel from:
- 2017 to 2018 (shown in the 2018 column)
- 2018 to 2019 (shown in the 2019 column)
- 2017 is shown as N/A because it’s the base year — no growth is calculated from it.
🔍 Interpreting the Numbers
| Channel | 2018 Growth % | 2019 Growth % | Interpretation |
|---|---|---|---|
| Corporate | -1.9% | +2.5% | Slight decline in 2018, modest rebound in 2019. Possibly stabilizing. |
| OTA | +5.9% | +3.7% | Consistent positive growth. OTA remains a strong revenue driver. |
| TA/TO | -24.0% | +36.2% | Sharp drop in 2018, but major recovery in 2019. Possibly due to pricing strategy or restored contracts. |
| Group | +36.2% | -20.0% | Strong surge in 2018 (event season?), but notable drop in 2019 — perhaps due to seasonality or market shifts. |
| Website | +5.7% | +5.7% | Stable and consistent growth — shows healthy direct channel momentum. |
| Direct | -24.3% | +2.0% | Significant drop in 2018, slight recovery. May need further investigation into pricing, conversion, or repeat guest strategy. |
| Total | -0.9% | +4.4% | Slight dip in 2018, solid improvement in 2019 — recovery driven by OTA, TA/TO, Website. |
💡 What This Means for Revenue Management
- ✅ Growth isn’t just about volume — it’s about managing the mix.
- • OTA, Website, and Group channels appear to have the strongest revenue momentum across the two years.
- • TA/TO and Direct show volatility — they require closer analysis of rate strategy, contract changes, or booking behavior.
- ✅ Stable growth in Website channel is a positive sign:
- • Suggests that investment in direct booking and digital strategy may be paying off.
- ✅ Group and TA/TO volatility highlight the need for:
- Better forecasting
- Strategic pricing
- Monitoring seasonality and lead time behaviors
Revenue Contribution by Distribution Channel
Revenue Contribution by Distribution Channel (2017–2019)
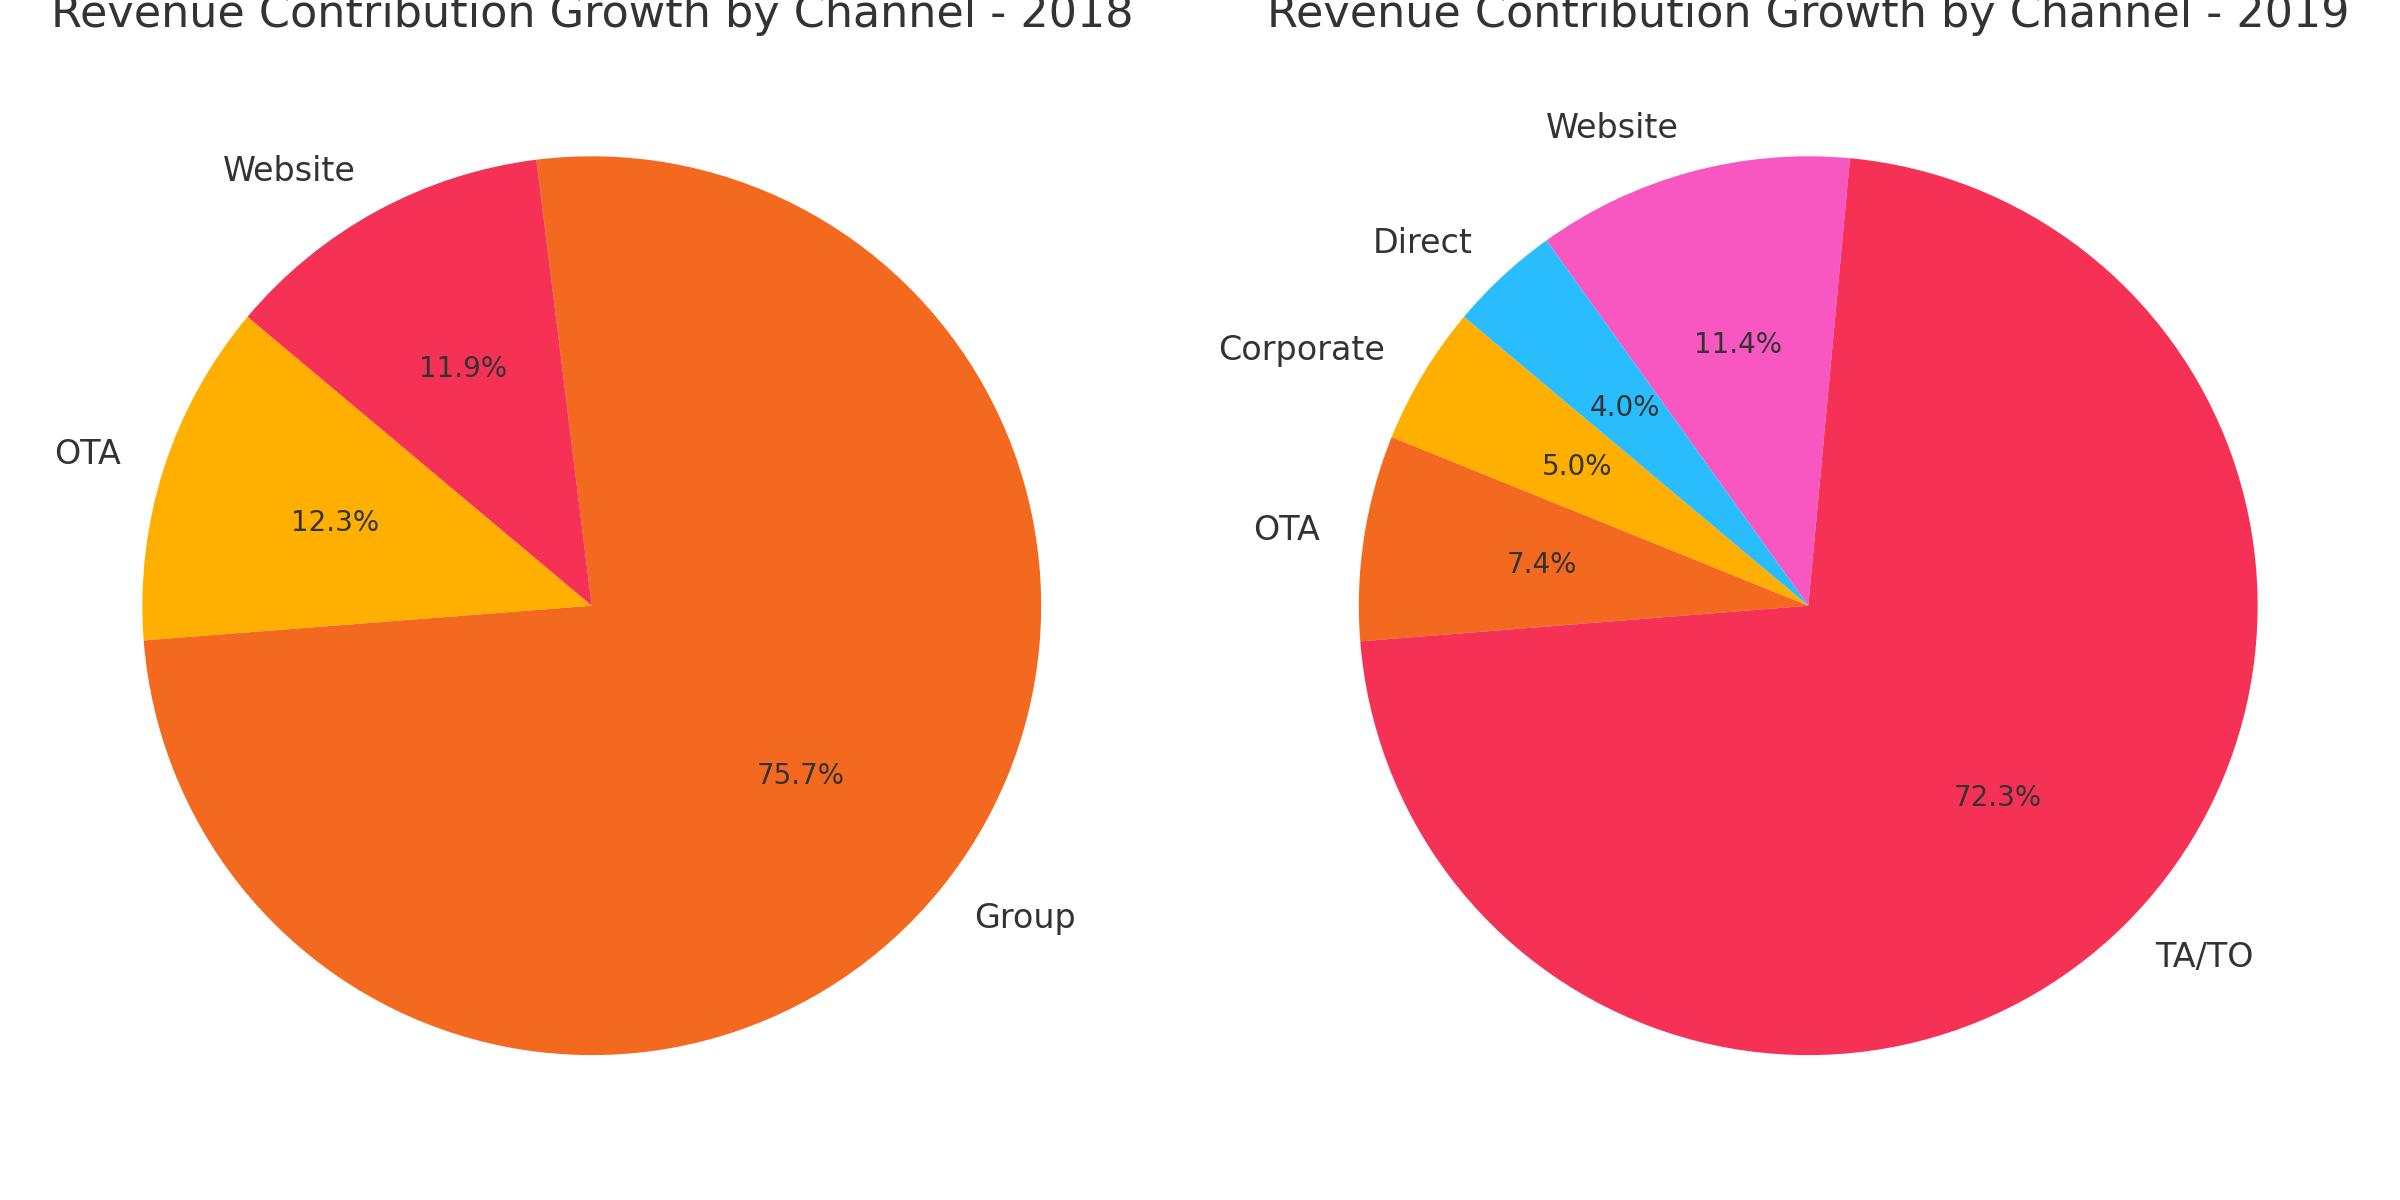
🔍 Explanation of Channel # Increases (2019 vs. 2018):
- 📈 TA/TO saw a dramatic increase from -24.0% (2018) to +36.2% (2019) — a 60.2% swing, indicating a major rebound or successful strategy targeting travel agents/tour operators.
- Corporate also reversed from -1.9% to +2.5%, showing improved contribution from corporate clients.
- Direct improved significantly from -24.3% to +2.0%, suggesting better direct booking efforts or fewer cancellations.
- Group revenue dropped sharply from +36.2% to -20.0%, a major swing downward.
- OTA and Website had consistent positive growth, though slower in 2019