Hotel Segment Forecasting
Measure weekly forecasting accuracy for room nights and ADR across segments, and uncover data-driven refinement opportunities.
📊 Reading Report Output
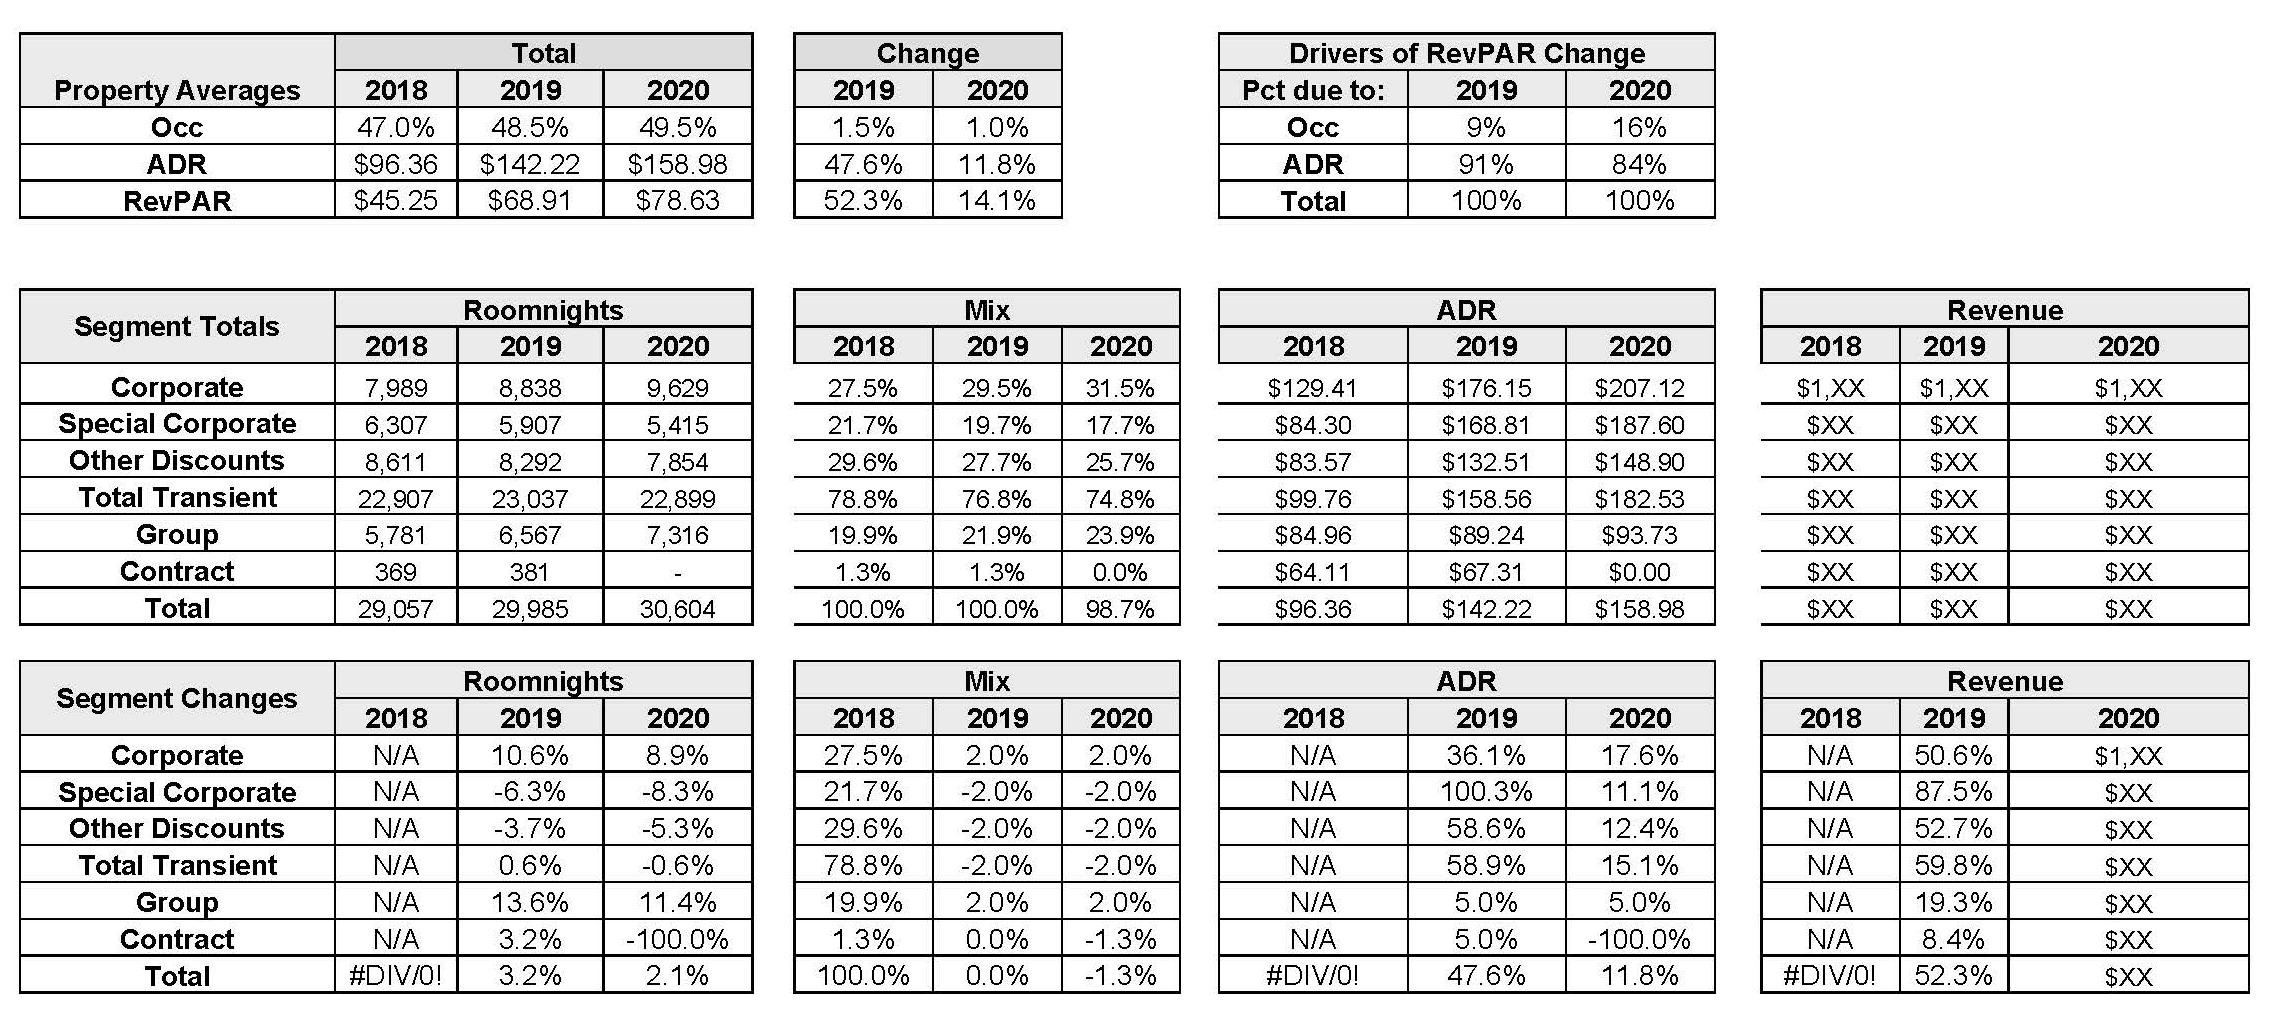
Report analgising to determine the how to spread RevPAR, Occupancy and Rate targets through all major segments and accounts. These output helps to read into Monthly Bases the total property view “total Properties 13 Boutique hotels”
Executive Summary page
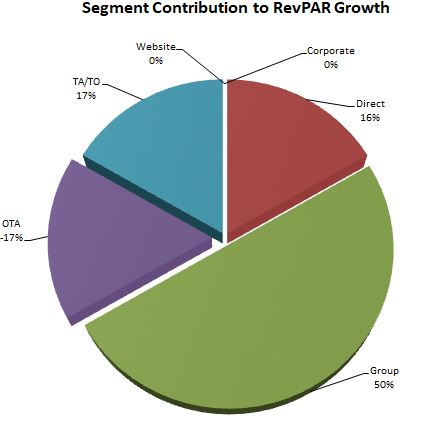
The first Section, with expected roomnight, mix and ADR change for 2019 and 2020.The second report pagee is a 2019 Segment Conribution to RevPAR growth
Final Output
📊Properties Averages Summary
Visualize weekly differences between forecasted and actual room nights sold and ADR, highlighting deviations that guide forecast improvements.
Properties Segment Overview
understanding what drives RevPAR change helps you: Identify whether growth is volume-driven (Occupancy) or rate-driven (ADR). Adjust strategy: If ADR is flat but occupancy rises → pricing opportunity. Align forecasting and pricing strategy by segment or season.
Properties' Averages
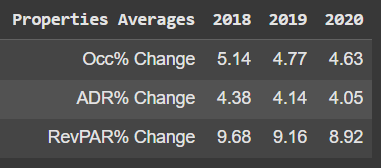
Average Changes
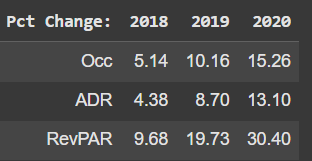
Drivers of RevPAR Changes
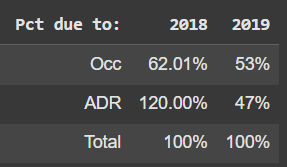
Here's how to interpret the values, especially the confusing 120% for ADR in 2018:
| Year | Occ (%) | ADR (%) | Total (%) |
|---|---|---|---|
| 2018 | 62.01% | 120.00% | 100% |
| 2019 | 53% | 47% | 100% |
📊 Table Breakdown:
🤔 What does it mean?
These values show what percentage of the RevPAR change is attributable to:
Occupancy change, and
ADR change (room price change).
Normally, the total should be 100%. But in 2018:
Occupancy contributed +62.01%
ADR contributed +120.00%
So total contribution = 182.01%
But it's still labeled "100%" in the total row — that's just for format consistency.
🚨 Why is ADR 120%?
This occurs when: Occupancy change has a negative impact on RevPAR (e.g., declined YoY), But ADR increased so strongly that it more than compensated for the occupancy loss, Resulting in RevPAR still going up, even though one component (Occ) dragged it down
✅ Here's the interpretation:
2018: ADR had a very strong positive effect, enough to overcome a decline in occupancy. Occupancy change was negative, but it's still shown as +62.01% because of how contributions are computed mathematically. This can happen when change direction is mixed and normalized. If the actual occupancy change was negative, then the ADR contribution would be greater than 100%, to make up for the negative effect.
🧠 Summary
Total = 100% is a normalization, even when components sum to more or less than 100%. When ADR % > 100%, it's making up for a negative occupancy impact. Use this format to show what is driving your revenue growth: price, volume, or both. Let me know if you want the formulas for how these % contributions are calculated.
Segment Total
Room Nights How many were generated by each distribution channel (segment) over three years.
Why it's important:
🧭 Tracks segment growth (e.g., Is OTA growing while Direct is shrinking?)
💰 Revenue strategy alignment (e.g., push high-ADR segments)
🎯 Marketing targeting (e.g., re-engage underperforming channels)
MIX (%) by Segmentfor each year — which shows how much each Segment to the total business annually. 🧠 Why This Query is Important Shows reliance on OTAs, Direct, TO/TA, etc. Helps identify shifts in booking patterns over time Useful for strategic planning and segment targeting Reveals disintermediation opportunities (e.g., shift OTA to Direct)
channel contribution over time
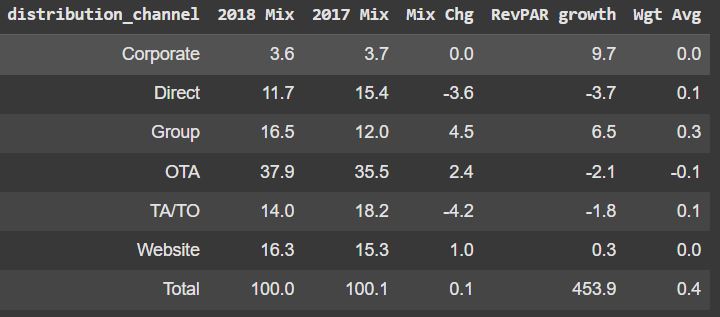
Channel Contribution Over Time
Channel Contribution Over Time